Existing instrument · Developing research area
Behind the
interface.
The Infrastructure Tracker grew out of trying to connect AI infrastructure locations to the electricity grids supplying them. It can help investigate geographic carbon intensity, available infrastructure data, and public disclosure patterns.
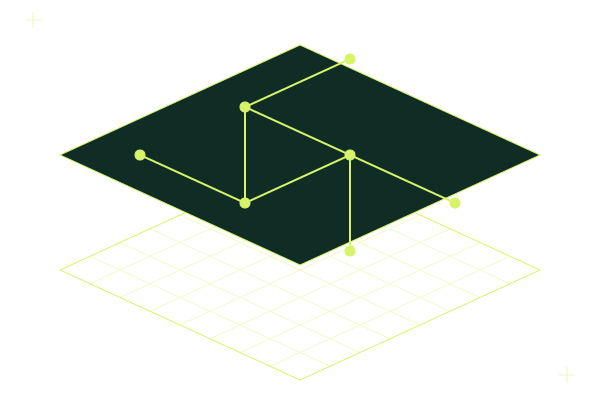
Conceptual illustration. Not measured data.
What this area
covers.
This area asks where AI data centers are, what electricity grid each one draws from, how clean that grid has been hour by hour, and what shifting computing load toward cleaner hours would change.
Its limits are stated up front: grid data describes the regional grid, not a facility's own power contracts or on-site generation, and no provider's measured electricity per prompt is public beyond one figure from Google.
Live now: the Infrastructure Tracker, with facility records, hourly grid intensity, fuel mix and a cleanest-hours comparison for each facility, and the full methodology behind every figure. Not yet published: standalone research notes for this area.
Intended scope,
not published findings.
- How the cleanest hours differ across the regional grids that serve AI facilities.
- When on-site (behind-the-meter) generation means regional grid data describes the wrong thing for a site.
- Why megawatt ratings and GPU-equivalent capacity sometimes imply different relative sizes for the same facilities.
- How much weight modeled per-prompt energy estimates can bear, using the published evidence by provider.
- A hypothesis, not a finding: whether the cleanest hours on these grids are also the cheaper hours. No cost data has been gathered or analysed yet.
Questions this area asks
- How much does the cleanest-hours opportunity vary between regions and seasons?
- What does public record show about on-site generation at the facilities tracked?
- Which assumptions in per-prompt energy estimates move the result most?
How the figures are made,
and where they stop.
This area's methods are published on the Methodology page, so they can be read and checked on their own. They include the following.
- Grid data and carbon intensity: the EIA source, the emission factors, and how missing hours are handled.
- How a facility is assigned to a grid, and why some facilities have none.
- Turning AI usage into energy: the published research behind modeled estimates.
- What's still unresolved, and the sources behind it all.